
Sandor van der Neut
Read all my blogsWe as ‘mere’ humans are not very good at processing raw statistical data visually when it’s delivered to us in an unrefined form. We are, however, very good in detecting complex patterns when data is presented to us in a graph or a chart. In fact, humans are often better able to see patterns than modern computer programs nowadays. So it is no wonder that we as software developers are often asked by our clients to visualize data in a more comprehensible ( read graphical ) way. If we take a look at the SAP CRM Web UI we see that the graphic possibilities that standard SAP is providing us are limited. As a developer I never want to settle for ‘No’ as an answer so in this blog I will explore the possibilities to enhance the SAP CRM Web UI graphically by using JavaScript libraries.
Graphic JavaScript Libraries
In my search for extending the graphical capabilities of the SAP Web UI I stumbled across this blog that triggered me to take a closer look at JavaScript charting libraries. After some searching I soon found out that there are lot of graphical JavaScript libraries around nowadays and as I didn’t want to spend a lot of time contemplating which one to take I decided to use D3.js, just because it was the number 1 graphical library in this top 15. The cool thing about D3.js is that it is, for starters, an open source project and besides that it has a lot of cool looking examples with their source code readily available online.
Creating a graphical chart in the Web UI
As I wanted to start simple, the first goal I was aiming for was just showing a simple bar chart on a web UI view. To achieve this the first thing I did was creating a Web UI form view and then added the JavaScript code for a simple bar graph to the HTML part of this same view. The D3.js JavaScript code I copied from Mike Bostock’s Let’s make a bar chart tutorial and the result was rather satisfying as you can see below.

One word of advice when copying JavaScript code in the HTML page of a Web UI view: I found out (the hard way) that the SAP HTML editor is not recognizing // as the one-line comment indicator. So avoid this type of commenting because SAP won’t see it as a commented out line but as a line of code and it will mess up things in a big way.
Feeling confident after my first victory I tried some more elaborate graphical charts and not without success if I might say. See the examples below and you have to admit your Web UI has never looked so cool and colorful before!
 |
| Figure 1: Aster Plot |
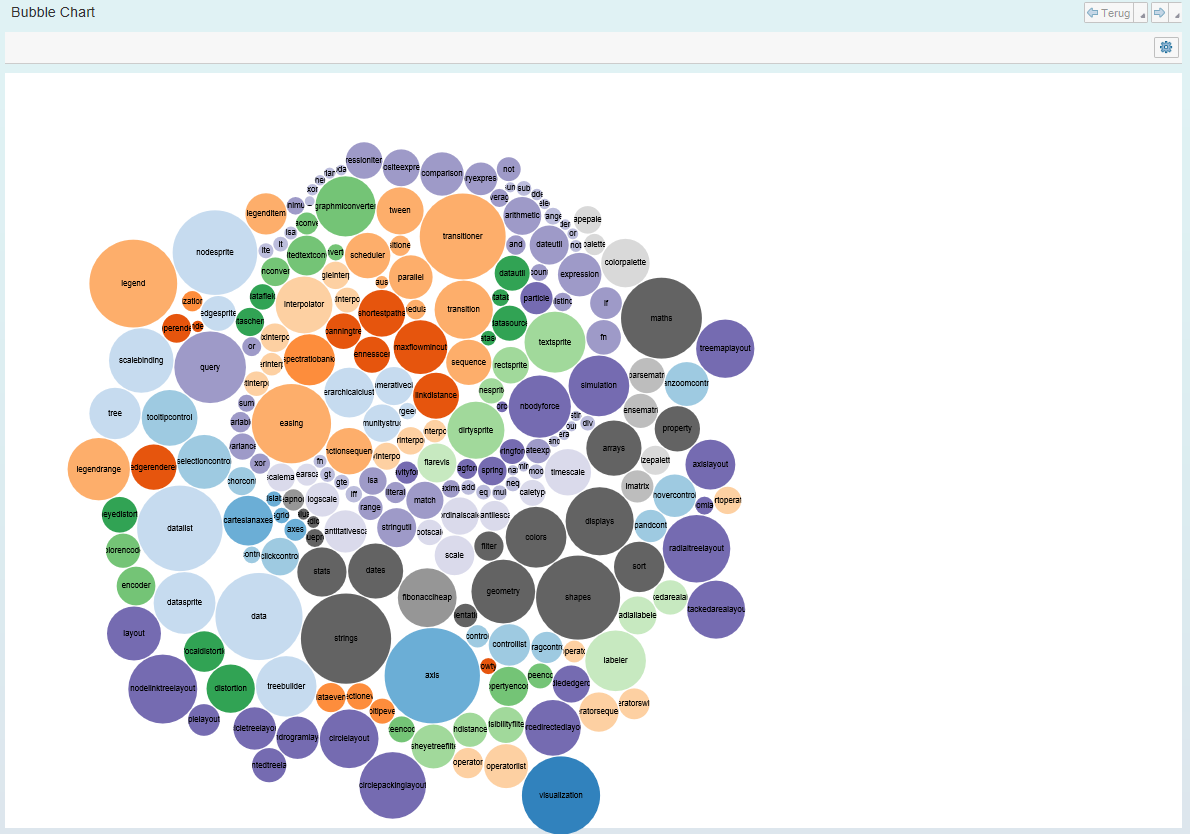 |
| Figure 2: Bubble Chart |
 |
| Figure 3: Interactive Collapseable tree |
Upload your JavaScript / CSS files into the MIME repository
To get access to your JavaScript libraries in your view you have to make the JavaScript sources available somehow. You can do it for example by adding the following code to your HTML page:
But however in most cases it will probably be better to store the JavaScript sources (and if necessary the CSS files) as MIME objects of your BSP page directly or if you are using the same library in multiple applications you can store it in the MIME objects of BSP application CRM_UI_FRAME.
This can be done in transaction SE80 with the import functionality

You then can get access by adding the following code:
Providing a chart with SAP data
Now that we have seen that we can use the graphical power of a JavaScript library in the view of a Web UI component we actually have to find a way to provide our charts and graphs with actual data coming from the SAP backend. The best way to go, in my opinion, is with JSON as JSON stands for JavaScript Object Notation and it will be surely recognized in the JavaScript Code of the HTML page. Besides that JSON data can be easily generated in ABAP from an internal table and in JavaScript it can be translated to a JavaScript data object without much effort.
Now let’s start with the SAP (ABAP) part. To keep things simple I returned to my first bar graph example which uses a flat table as input with only two fields ‘Letter’ and ‘Frequency’. In the view controller class of my Web UI view I created the method GET_JSON_STRING which first fills an internal table with randomized data. This internal table is then converted to JSON data as a string which is returned. See code example below.

With the ABAP part in place we have to make the data available in JavaScript as well. I did this by calling the method GET_JSON_STRING from the controller class and subsequently create a JavaScript data object using the parsed JSON data. This can actually been done in a single line of code. As shown below.
The data object (var data) is now in the same format that this bar graph example can handle and it will be used to populate the bar graph on screen. Take note of the ‘.text’ at the end of the last statement. This .text is necessary because it is in fact the source parameter we defined earlier in the transformation we did in the ABAP code and it is added at the beginning of the JSON data string.
After I did my changes it was time for testing and to check if it worked. I pressed refresh (F5) a few times and I saw that the bar graph is updated every time with the newly generated random data. Proving to me that the SAP backend is providing my graph with data!
After this relative simple example I tried a more complex one but it is in fact using the same techniques as described above. The example below depicts a simple force-directed graph that shows character co-occurrence in the famous theatrical play Les Misérables. Probably not a requirement you will ever receive from a client but it makes a cool example none the less.
 |
| Figuur 4: Force Directed Graph |
In this example I first upload a JSON file in my Web UI view and store it in a context node before passing the content to the HTML page again with the method GET_JSON_STRING from the view controller class. The cool thing in this example is that you can physically manipulate the nodes in the graph and that it shows the wide variety of graphical tools you have at your disposal.
Taking it to the next level – part 1.
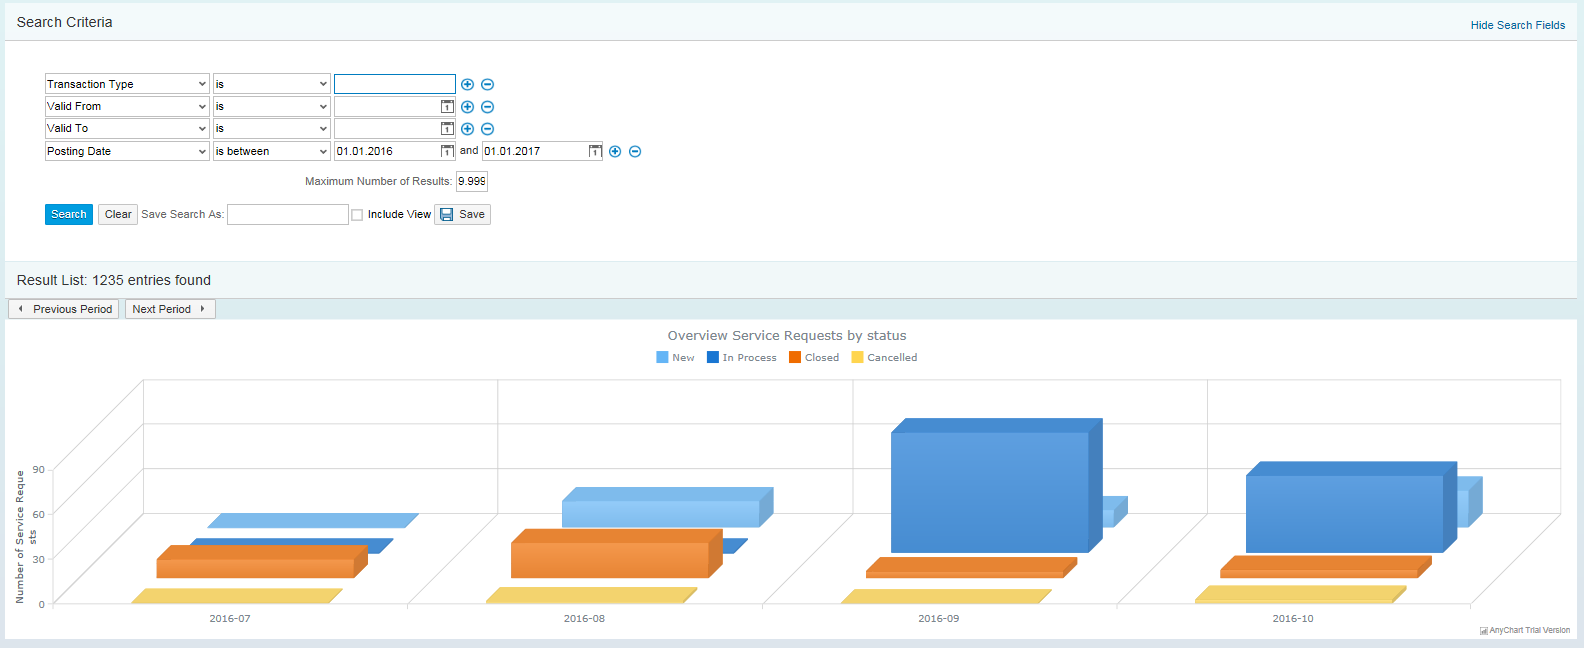
Now that we have seen the basics it’s time to ramp it up a notch and create a more realistic business scenario where graphics are being used to present data. So I decided to build an application that will show all service requests for a certain period of time grouped by status. To achieve this I created a searchpage with a resultview based on the standard dynamic query BTQSrvReq. I replaced the standard result view with a result view that contained my bar graph JavaScript code . For this example I used another JavaScript chart library called AnyChart with the sole purpose to prove that you are not limited to one particular graphic library. I used more or less the same ABAP code to convert the query result data to JSON data. But in the JavaScript code of the HTML part of the result view I had to put some more effort in getting the data in the right format.

With the JavaScript code in place we had a fully functional WebUI application and he final result was rather satisfying!
Taking it to the next level – part 2.
As a last showcase I wanted to create a fancy looking dashboard that will clearly illustrate the graphical possibilities of JavaScript libraries and how it can enhance your Web UI views. I found this cool example on the AnyChart web site and made some small modifications so it was able to run in the Web UI. In my opinion a good example of what is possible.

Conclusion
By using the graphical power of JavaScript libraries you are able to lift your visuals in the Web UI to a whole new level. With relative ease you can make the SAP data available in a format that the JavaScript libraries can use. As far as I can see you are only limited by your own imagination and in minor extend by your JavaScript knowledge. There are tons of cool examples to be found online and lot of different libraries you can use. I hope you get inspired by the examples I showed here and that you find a practical use for them.
Receive our weekly blog by email?
Subscribe here:

