
Pieter Rijlaarsdam
Read all my blogsDifferent companies have a different view on how to do marketing. But ask any marketer, and he will tell you the importance of knowing and understanding your customer.
SAP Marketing Cloud enables you to gather customer information from many different sources, analyse the information, and use them in campaigns, either manually triggered, scheduled or based on events.

This sounds like a nice process, but there is much more to it.
Gathering data
The first step is generally the same everywhere. You gather data from different sources:
- Manual file upload (if you don’t have a centralised Customer database).
- Integration from a CRM system such as SAP Cloud for Customer.
- Integration from a Commerce (webshop) environment such as SAP Commerce Cloud.
- Integration from Google Analytics.
- etc.
The data is divided into Customers, Interactions, Interests, Orders, Products, Contracts etc.
Analysing data
So now we have this huge pile of data. This is where the Marketers expertise comes in.
- Who are my customers?
- Why are they my customers?
- What are they worth?
- Can I tempt them to buy again? And how?
- How can I prevent them from leaving?
- How can I divide these customers into logical groups?
- How can I make sure I stay in touch with my customers?
- etc.
Targeting customers
The result of the analysis should be a proper feasible plan on how to reach out to the customer, with what message and with which offers.
To achieve this, Customer Segments will be created reflecting the groups defined and campaigns will be planned containing the correct message and correct offer for that group.

Analysis using SAP Analytics Cloud
SAP Analytics Cloud is SAP’s analytical product in which you can load data from multiple sources, or (as is the case for Marketing Cloud), create dashboards on live data. Technically speaking, SAP Analytics Cloud utilizes the data from SAP Marketing Cloud’s HANA database to in realtime gather the data for the report. So in this case, no data is stored in SAP Analytics Cloud.
This enables us to generate nice reports directly on the online data.
After setting up the seamless intergration, we are able analyse the data using standard reports and stories, such as the Marketing Executive Dashboard.
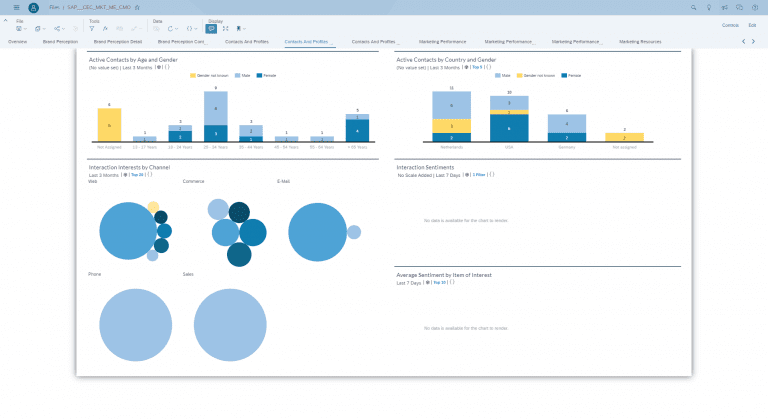
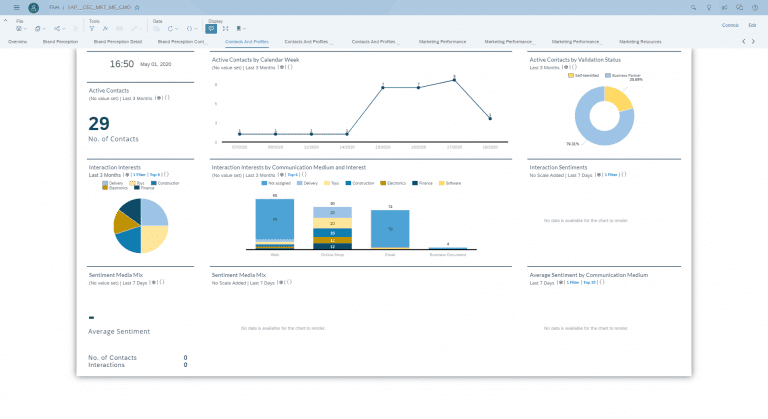
Marketing Executive Dashboard
This dashboard is a standard story containing insights on contacts, interactions, campaign performance, marketing resources, revenue, sales pipeline, brand perception etc.
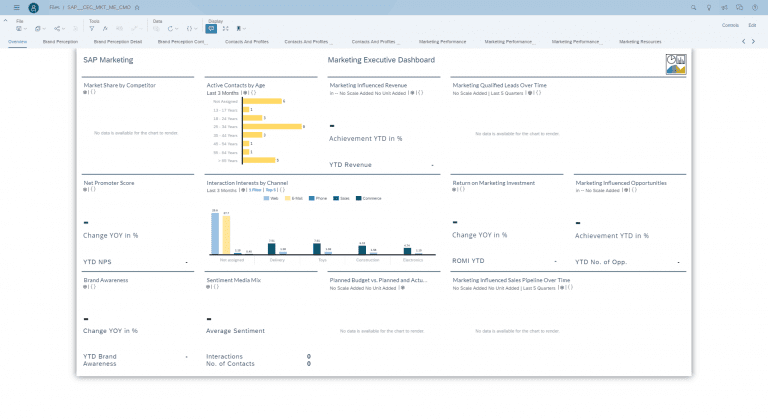
It is unlikely all processes are implemented immediately, so it is likely you should adjust this a little bit, but at least it gives a good impression on the possibilities.
Analytics and Report Gallery
Another great out-of-the-box feature is that all reports that have been created in Analytics Cloud are automatically available in the Analytics and Report Gallery.
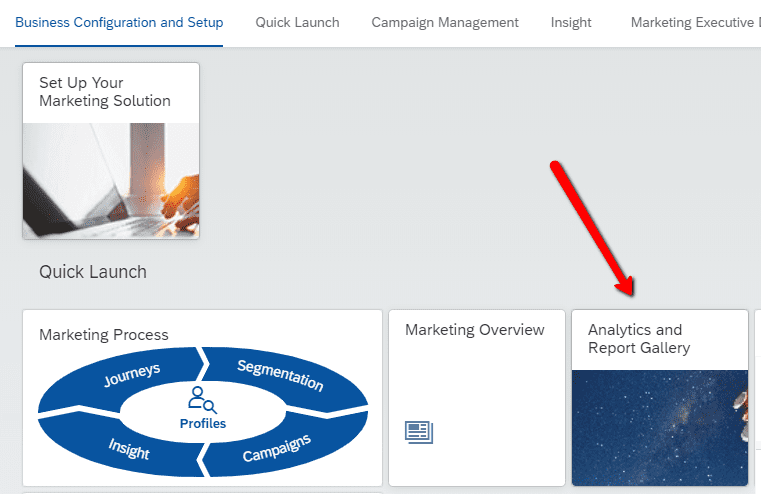
Here you can find all reports, even if you have created them yourself in SAP Analytics Cloud.
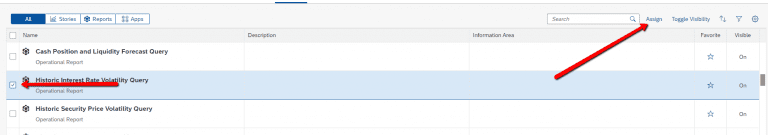
Custom built reports or stories will be available in the ‘Unassigned Elements’ block. If you navigate to the ‘Show as List’ view, you will be able to assign the report to another category.

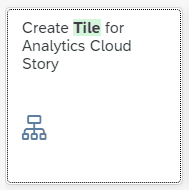
Custom Analytics Cloud Tile
You can also choose to create custom tiles for specific reports or stories.
Note that after creating the application ID, you have to re-log-on to be able to add the tile to the page.
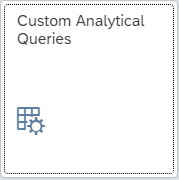
Custom Analytical Queries
You can even create your own fancy dashboards with on your own custom analytical queries.
This allows you to make custom analyses, taylor made to your situation.
To do this, go to the tile ‘Custom Analytical Queries’.
Click New, select the proper Data Source, for instance ‘I_MKT_CORPORATEACCOUNTCUBE’.
Follow the wizard where you select the relevant fields and how to display them.
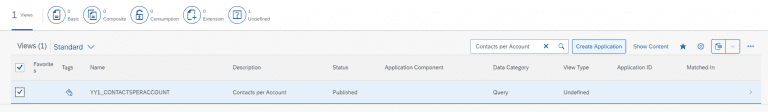
In the example below, I am creating a query to show the number of contacts per account.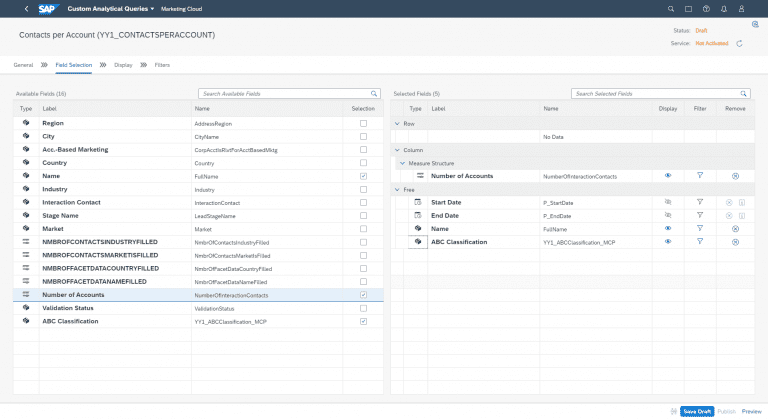
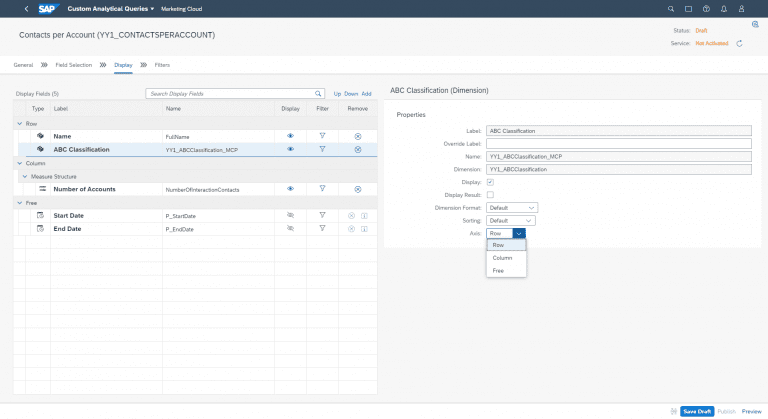
In the ‘Display’ step you have to choose whether you want to display the field, and (very important) if it should be a row or a column field.
In the ‘Filter’ step you can add Fixed filters (to for instance create an analytical query per marketing area) or add a filer on user input values (which makes sense because you want to be able to add parameters in your story.
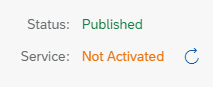
Then Save Draft and Publish.
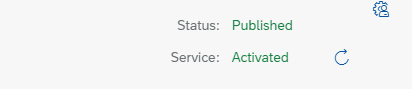
You will notice in the top right corner that the Status is now Published, but the Service is Not Activated.
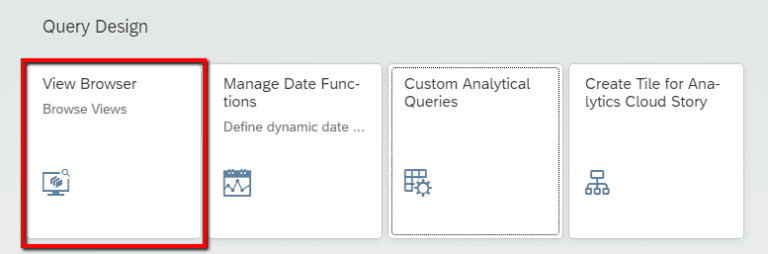
In order to expose the query to Analytics Cloud, you should go to the View Browser app.
Search your query in the list, select the line click the Create Application button and select ‘Multi-Dimensional Report’.
The application definition is now created.
Note that the status is now ‘Activated’.
Before you can use the query in Analytics Cloud, you should also add the application to a business catalog.
To do this, open the application, click on the button ‘Show Application Status’.

In the screen, search a relevant business catalog, add it to the view, select it and click ‘Publish’.
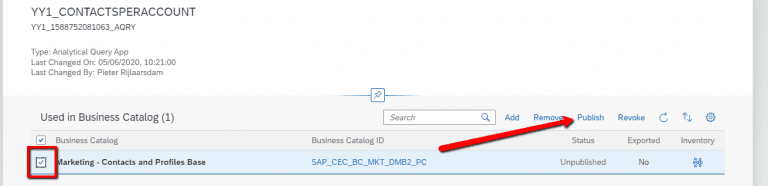
Publishing the application might take a few minutes.
The query can now be used in an analytical model in SAP Analytics Cloud.

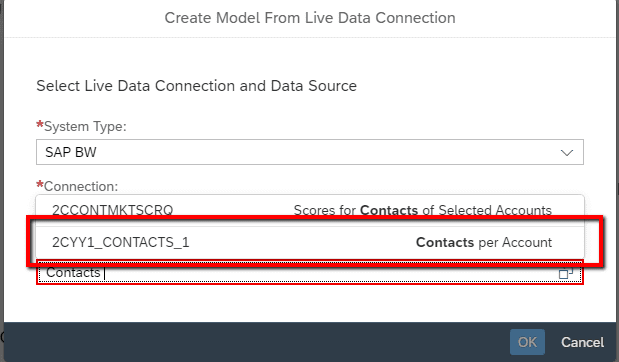
Once the model is added, it can be used to display a table, KPI or chart in one of your stories allowing you perform your taylored data analysis or keep track of strategic processes.
Receive our weekly blog by email?
Subscribe here:

