
Jelle Uenk
Read all my blogsIn this blog I will describe how to setup and report customer satisfaction KPI’s like the NPS metric when the standard SAP Sales Cloud solution is not working for your situation.
Let’s assume you have several customers and want to measure their customer satisfaction. For this, SAP Sales Cloud provides you with the logic to send surveys to customers via email and record their responses for future analysis. My colleagues have already written some blogs on this topic, e.g. here and here
Survey answers in the data sources
When the customer submits the survey answers, the SAP Sales Cloud system receives the answers and stores them in a set of standard data sources. SAP Sales Cloud provides various standard data sources with the survey answers, e.g.
- Business Partner Survey Answers
- Opportunity Survey Answers
- Ticket Survey Answers
- Visit Survey Answers
Each individual question/answer response is stored as a single line in these data sources, using a unique ID (field ValuationQuestionNodeID)
The nice part of using these predefined data sources is that they allow you to use predefined KPI’s for customer satisfaction metrics like NPS and CES.
Joined data source issues
In a recent project, we had to enhance the standard SAP Sales Cloud logic to store the function of respondent at the time of this survey. If a respondent fills in the survey, he/she is usually answering the questions according to his current function. If you want to measure the satisfaction over a longer period of time, the respondent could have changed job from support employee to e.g. team manager, and therefore might give a different answer to the same question. If you want to be able to drill down in the satisfaction results, you would like to see if there is difference between the various job functions in your survey results.
The solution that was implemented offers the possibility to store some additional data (Function, some additional custom fields, plus ticket ID and Opportunity ID) in a separate data source when the system receives and saves the survey answers. By creating a joined data source of the standard Business Partner Survey Answers and our own custom data source, all information is now available for reporting.
So far so good. However, an unexpected side effect is that you cannot use the predefined KPIs (as mentioned in this SAP Knowledge base article) like NPS and CES anymore
The only way forward now is to recreate the key figures yourself to be able to use them in reporting.
NPS key figure calculation
I have detailed below how to recreate the key figures for the NPS calculation. In our survey, the NPS relevant questions was: “Would you recommend us to your colleagues or friends?” – with allowed scores 0 (very unlikely) to 10 (very probable).
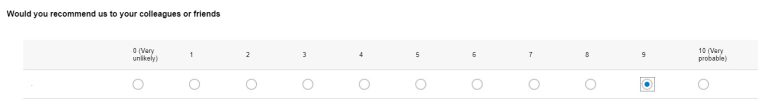
Figure 1: example NPS question
NPS defines a very happy customer as promotor if he/she answers with a 9 or 10. Scores 6 or lower are seen as detractors.
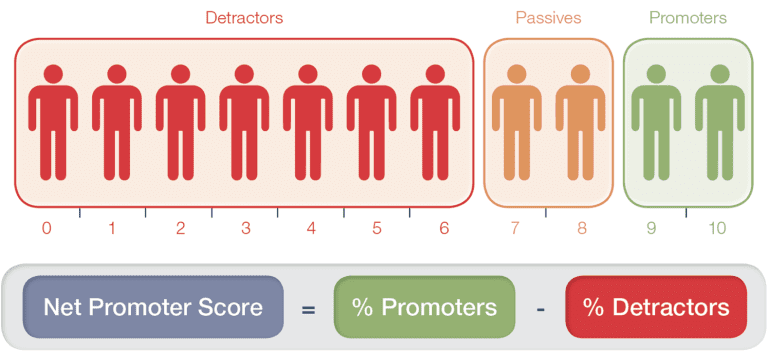
Figure 2: NPS definition
As explained here, the Net Promotor Score (NPS value) is calculated by “distracting the distractors % from the promoters %. So, for example, when 20% of the respondents are promoters and 15% of the respondents are detractors, the NPS is 5.” Based upon this logic, the NPS ranges from -100 to 100.
Now back to SAP Sales Cloud, where we calculate our own NPS KPI score:
• Take only answers into account which refer to our NPS question (since there are other non-NPS questions in the surveys as well)
• Count the number of Promoters (all relevant survey answers with score 9 or 10)
• Count the number of Detractors (all relevant survey answers with score 6 or lower)
This boils down to these formula’s
Restricted key figure:
[abap]
NPS_YES = Number of NPS answers (in our case, it is a valid count when the category was NPS)
[/abap]
Calculated key figures:
[abap]
Number of Customer NPS Detractors = COUNT (([Rating] LE 6) AND [NPS_yes]) +0
Number of Customer NPS Promoters = COUNT (([Rating] GE) AND [NPS_yes]) +0
NPS score = NDIV0 (([Nr of Customer NPS Promoters] – [Number of Customer NPS Detractors]) * 100 / [NPS_yes])
[/abap]
In the above formulas, a zero was added to be sure we always have a valid numeric value.
Now we have the data available…
When we have the data available we can create a report on the joined data source, and create the report view showing answers with details,
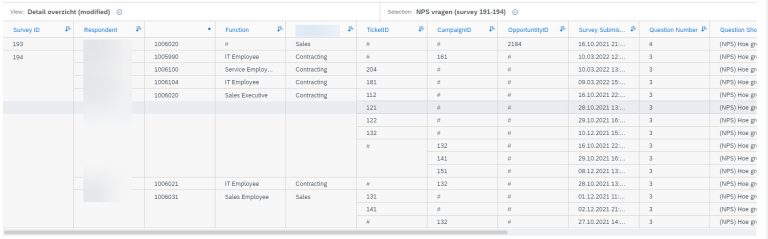
Figure 3: Survey result detailed responses
or display the summarized KPI’s like our calculated NPS.
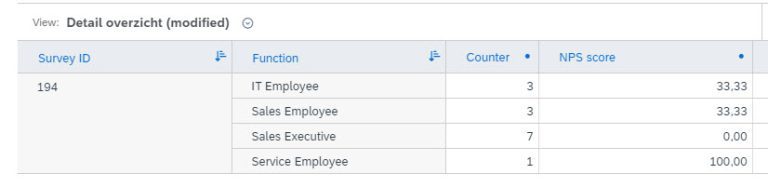
Figure 4: NPS in survey response data source
Similar formulas can be set up for the other important customer feedback metrics like CES (Customer Effort Score) and CSAT (Customer SATisfaction score).

Receive our weekly blog by email?
Subscribe here:

