
Gert-Jan Stolmeijer
Read all my blogs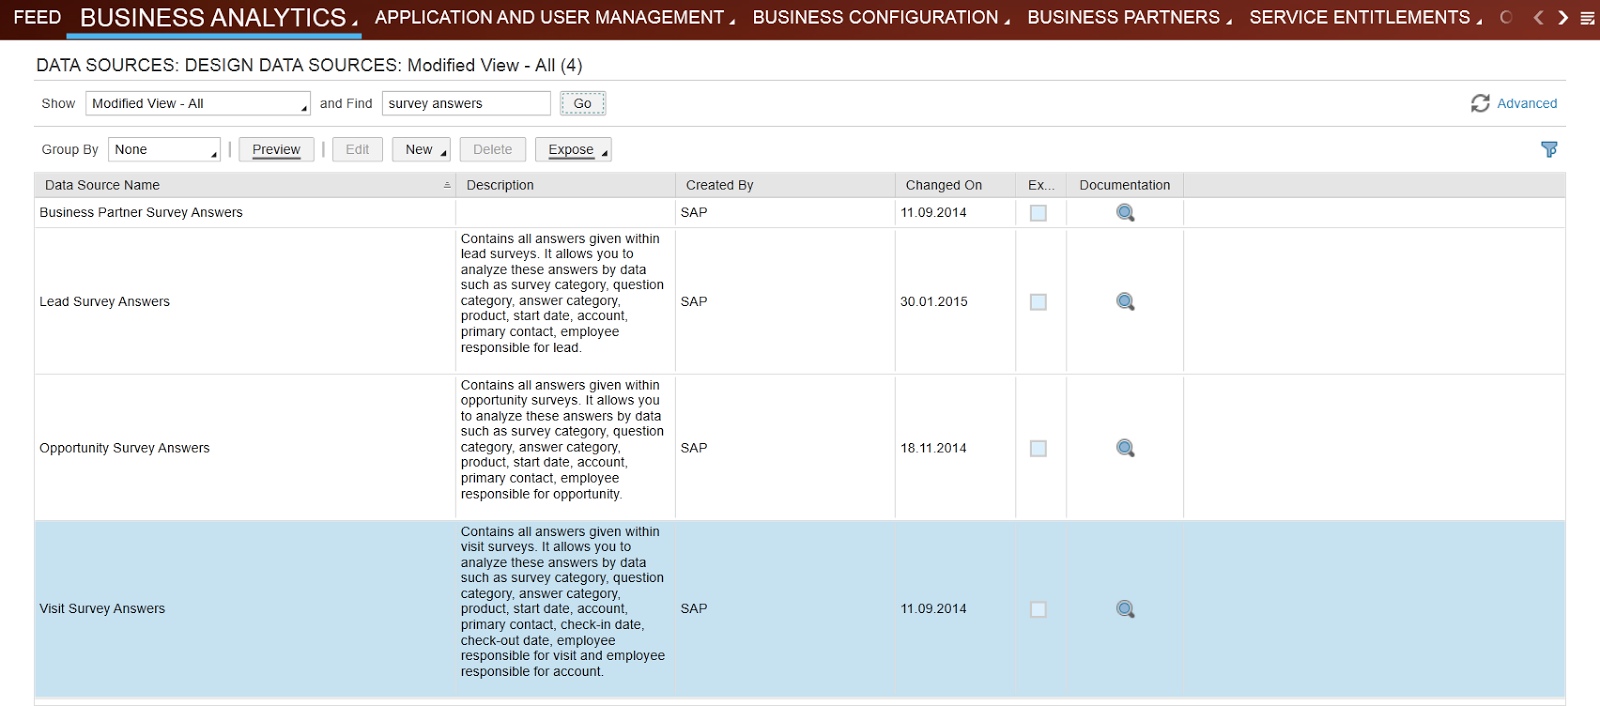 |
This blog will explain how you can create your own reports in SAP C4C based on given survey answers. Using this report you can analyze all given answers.
SAP C4C support the use of surveys. This blog will not explain all the different types of surveys and how to build a survey, but only focus how to build a report on the survey results.
Surveys can be used to register answers on predefined questions and can be used in leads, opportunities and visits. In this example we will focus on the survey results for visits.
Survey Results from the Survey
In SAP C4C release 1502 a new functionality is introduced called survey results. This functionality supports display and exporting of survey result in MsExcel. The results can be access from the survey menu as demonstrated in the next printscreens. Select export to create the MsExcel file
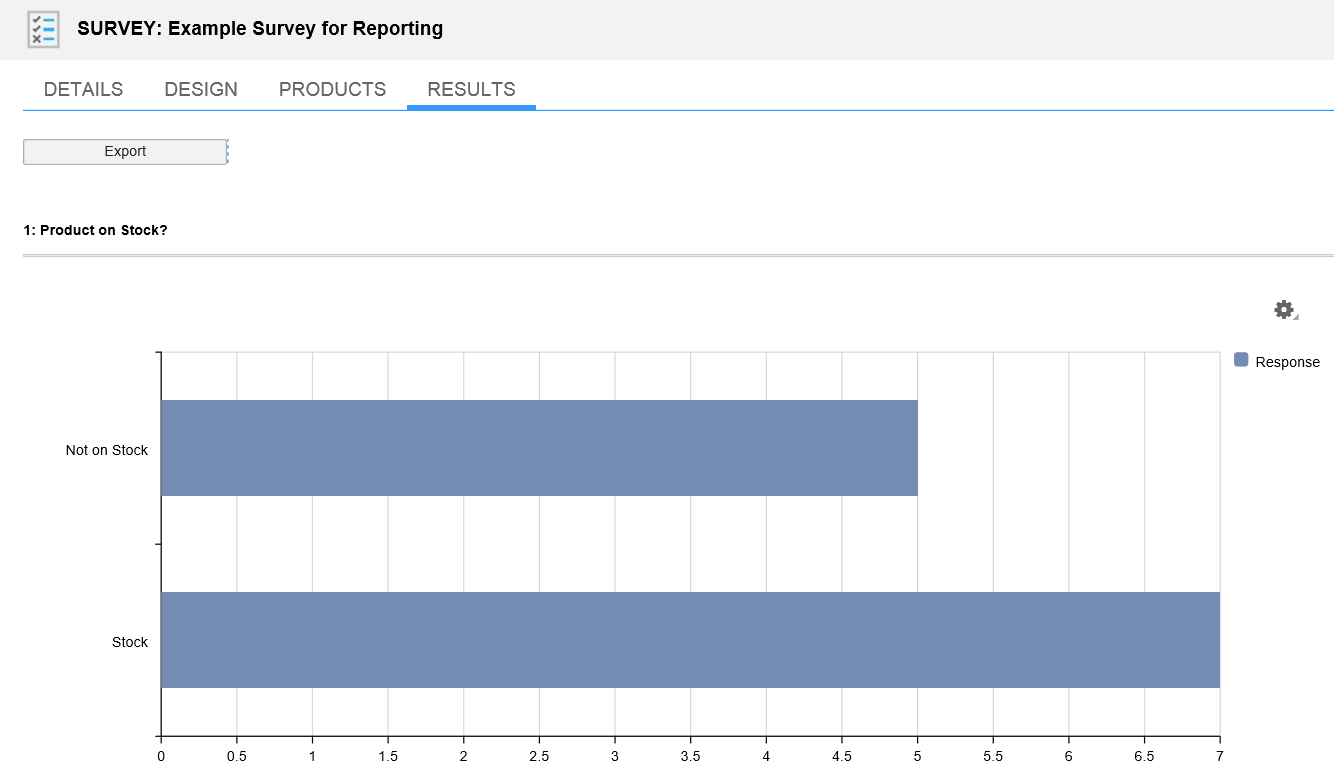 |
| Survey result from the survey Menu |
 |
| Export from survey results |
The results however cannot be used for reporting in SAP C4C, mainly because the export does not include account and product numbers only descriptions.
SAP has created three datasources to analyze the survey results. Based on the description you expect the answers to be available in these datasources. This is correct, but the answers is will not be visible directly.
|
| Datasources to analyze survey results |
Survey Results Report
First step to be able to report on the survey results is setting up the survey using question categories and answers categories. For each question and answer a different question category and answer category must be defined. As from release 1508 it is now possible to maintain short descriptions for the question and answers. This is very useful when building reports.
In case the question is of type quantity or price only the question category is needed, but feel free to also define an answer category. For the multiple choice question define an answer category for each answer.
 |
| Example amount question setup |
 |
| Example multiple choice question setup |
Second step is to build a datasource which consist of the ‘visit survey answer’ datasource and additional datasources you need for reporting. In our example we have added datasources ‘Visit survey answers’, ‘Employee master data’, ‘Account details’ and ‘Product master data’.
To report on the answers you need to include the characteristics ‘question category’ and ‘answer category’ from the datasource ‘visit survey answers’ and also the keyfigure ‘amount’ and ‘quantity’!
 |
| Example datasource including visit survey answers |
Last step is to build the report and make use of the question and answer categories. First create the report based on your datasource. Make sure that amount and quantity are listed as key figures.
Now when you run the report all answers are accumulated by SAP, because the datasource does not support an answer field for each question. The report will look like this:
 |
| Standard output for visit survey answers |
Now we use the trick to show the individual answers for each question. Add the question and answer category to the column ! The system will now split the accumulated amount and quantity fields based on the different categories. As a result each answer is visible now.

To complete the report you can remove the empty columns in the report using following setting (make sure you remove the ‘apply suppression to key figure group’)
| Remove empty columns |
Now the report will show all individual answers for your own questions! Good luck with building your own report on the survey results.
 |
| The final report |
Receive our weekly blog by email?
Subscribe here:


5 responses to “How to report on SAP C4C Survey Result”
Hi Gert-Jan
Thanks for this good summary of survey reporting and for detailing the shortcomings of the current functionality in C4C. We looked into this before as well and were disappointed that questions and answers are not directly available in the survey data source.
There are, however, issues with the approach of defining separate question and answer categories for each possible question and answer:
1. The administrative overhead is significant, especially for large numbers of surveys with many possible questions. For surveys used in field service scenarios (technician surveys) – with dozens of technical questions – it's almost impossible. On top of that, one also has to assign question and answer categories to suitable survey categories.
2. Most customers would have different roles in the organisation for maintaining surveys (key users, business support staff) and defining survey/question/answer categories (IT support, external consultants). Therefore, it becomes quite difficult to make the creation of new surveys an ongoing business activity that doesn't require involvement by IT.
3. Question and answer categories are part of business configuration (customising), so access is usually restricted (see point 2). I'm not entirely sure right now, but changing those categories probably even requires an open implementation project.
My understanding of the categorisation is that SAP intends this to be used as a way of combining multiple different questions and answer options into one report, as long as they can be categorised and cumulated in a semantically similar way. For instance. a question category used for survey questions measuring quality could have three associated answer categories: Low Quality, Medium Quality, and High Quality. Then, for an actual survey, a particular question might offer the option to provide a rating between 1 and 10. In that case, one could map answers 1 to 4 to the Low Quality answer category, 5-6 to Medium, and 7-10 to High. Another question could provide answer values from 1 to 5, and yet another question could provide three distinct answer values of Low, Medium, and High. Reporting on the answers to this survey would therefore not give the precise answers for each question but instead a categorised summary of the answers based on how actual answers are assigned to answer categories.
Just my two cents.
Best regards
Matt
—
Matthias Braeuer
SAP CRM/C4C Consultant
Thanks
According to the last SAP announcement call, C4C 1602 will most likely include the ability to report on the actual survey questions and answers. That will make this task a lot easier.
Cheers,
Matt
Good day Gert-Jan,
This only work for answers with ratios? I´m dealing with text-multiselect answers.
Thank you!
Hi, i hope that help me.
In C4C the results of surveys can be export in format PDF?
currently en Release 1802 I can´t do it in Platform WEB, but i did in aplication of SAP