Marco Meijs
Read all my blogs With SAP Cloud for Customer (C4C) Analytics you can create very nice reports that provide real-time data. The flexibility C4C offers, gives the user the data they want to see, when and wherever they want. This is a big advantage of C4C and the possibilities seem endless. This really engages the user in working with their own data and often triggers them to request new features.
During one of my assignments a request for a report was made containing only certain data from a datasource and joining it with another datasource. The best way would be to create views from existing datasources instead of filtering in the report itself. In this blog I want to show you how to create a view from a data source. This works very well but should only be used for data that does not change very often.
Create a data source that acts as a view
- Create a cloud data source “Cloud Product ID” and upload the ID’s of the products you want to use
- Create a new data source “Product data source view” where you join the “Product data source” (based on ID) with the “Cloud Product ID data source”
Using multiple “views” in one report
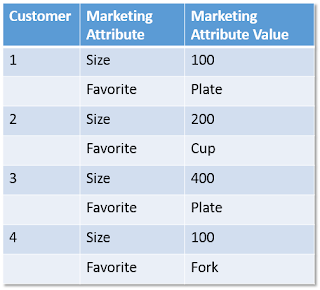
- Create a cloud data source “view” for marketing attribute Size containing all the values defined for the marketing attribute. In the example I use I only have 100, 200 and 400. In reality there could be more values (100,200,300,400,500,etc..) so add (upload) all of them to the cloud data source.
- Create a cloud data source “view” for the marketing attribute Favorite. Here also you need to add all the possible values that have been defined for the Favorite marketing attribute (not only Plate, Cup and Fork)
- Join the “Size” and “Favorite” cloud data sources with the customer data source baased in customer_id. This part can be a bit tricky depending on how many joins you need to make.


