
Sayana Sathasivam
Read all my blogs4 SAP Cloud for Customer features to boost an efficient way of working
Sayana Sathasivam, 22 April 2020
Being a Young Professional in the SAP Cloud for Customer world seemed like a challenge at the start of the Corona crisis. This crisis has a big impact on our way of living, but also on the businesses. Not being able to walk to a colleague to ask a question and having all your meetings and discussions remotely was all new. After successfully working from home for 2 months, I would like to share my experience on how to make the most of this crisis.
A challenge we faced was that support work was less as many customer-facing processes had stopped in industries like retail, public transport, travel and education. With all these SAP users having some spare time, we took this opportunity to schedule those long-awaited trainings and get documentation to a next level. Having proper documentation ready will help you work more efficient in the future when users come with questions about the discussed topics again. They can be easily forwarded to the training documentation.
While giving these trainings, a remarkable number of users were not aware of some of the most basic functions of SAP Cloud for Customer. Despite having access, they simply never figured out how to use it properly. Therefore, a little training can make a big difference in efficient use of the system. Let’s have a look at these SAP Cloud for Customer features in detail.
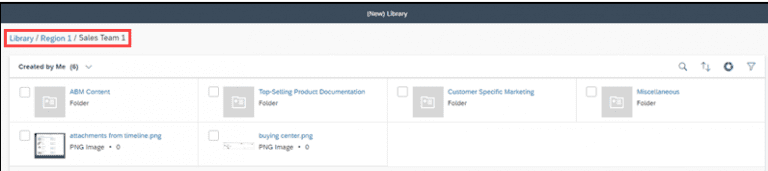
1. The Library
Often companies make use of a Drive or SharePoint to store certain documents, but did you know that you can easily find and store your documents in the SAP Cloud for Customer Library? You can organize your documents using folders and you can even manage the access to folders and documents. However, there are some points to keep in mind:
- To be able to use this function, the (New) library must be enabled and the work center view must be assigned to the business users or roles.
- Once you have access to the library, you can easily add documents and group them in folders.
- As an owner of a document or folder, you can define whether it is private or public. The access to a private document or folder can be restricted to specific sales data, accounts, employees and territories.
- Public documents are publicly accessible (meaning without an SAP Cloud for Customer user). This is generally used to for instance share publicly available documents with customers via email and to store images used in HTML email templates.
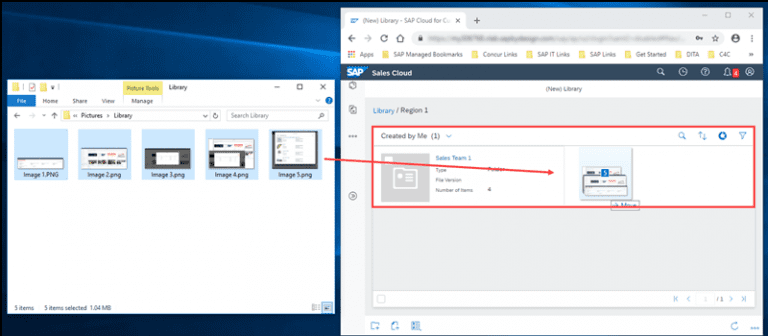
To make it even easier, you can place documents directly into folders from your own device using drag- and- drop.
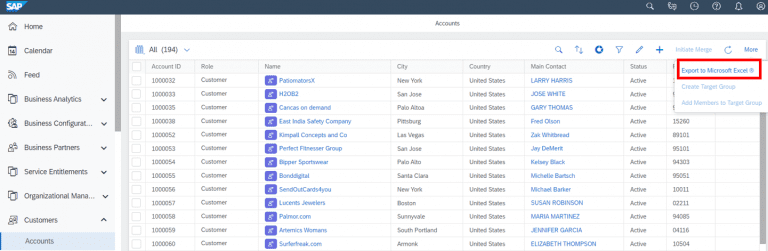
2. Using the Personalization Mode when making an export to Microsoft Excel
When a user needs to have an overview of all their accounts, with some specific contact details, they might at first think about creating a report. It is actually much easier to make an extract from your account list view to Excel. You should open your Accounts list view, click on ‘More’ in the right corner, where the option to Export to Microsoft Excel will be available.
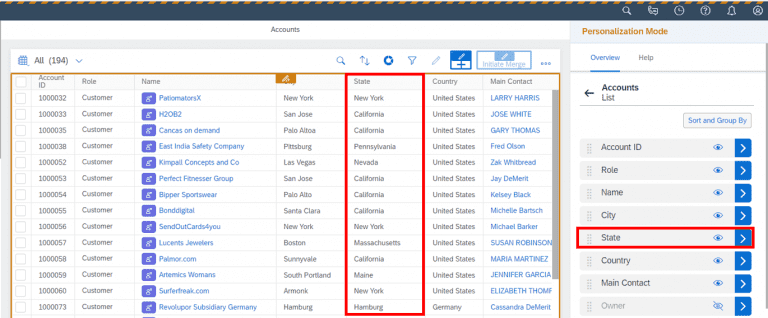
Sometimes, not all required data is visible by default. By enabling the Personalisation mode, you can easily add and remove rows in your view. You can hide and show the view by clicking on the ‘eye’ symbol. As you can see in the example below, the field ‘state’ has been added to the Account View. After adding the needed columns, make sure that you ‘End Personalization’ via your user menu.
Note that the personalization mode will only be available when the admin has given access to this function.
As you are using the Personalisation mode, the changes are only applied to your own view and not visible to others.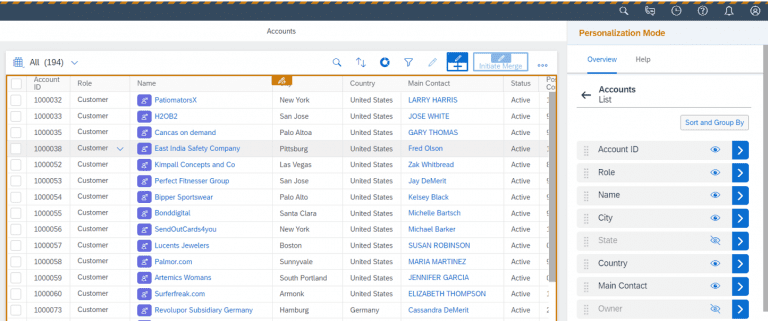
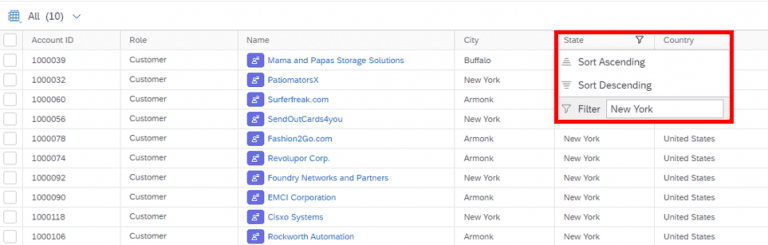
When you have the desired columns, a filter can be applied to every column to make your view even more specific. In the example below, only the accounts in the state of New York are visible.
3. Advanced Filters
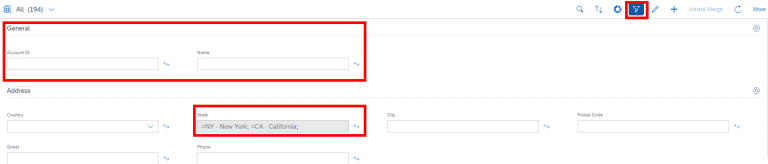
Imagine that you want to have a list of all the accounts that have an active status, from the states of New York and California. To be able to do this, you should make use of the advanced filters. When having a huge list of Accounts, you can use the advanced filters to drill down before you make an export to Microsoft Excel.
Also, in this case you might want to use a different advanced filter than available. In this case, you can start the personalisation mode and check if the required filter is available. In the example we do see the field ‘state’ which can be filtered, but the status of the account is not available in the general filters.
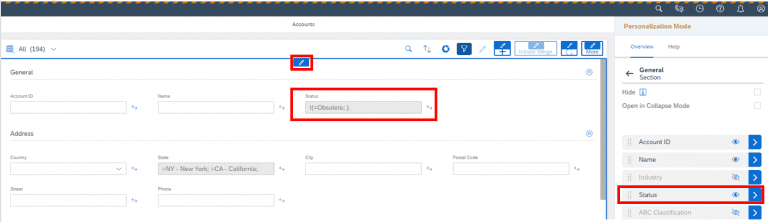
The advanced filter for Status can be added with the personalization mode. Start the Personalization mode, open the general filters, click on the ‘eye’ symbol to enable the status filter and end the personalization mode.
Finally, I would like to advize to always check first if you can get your data by making an extract from the list view. When this is not possible, you can try to use an existing report, create a new report or make an export using the Data Workbench.
4. Broadcasting
Did you know that you can use the Broadcasting function to receive a download of a report in your mailbox on a daily/monthly or weekly base?
This function enables users to frequently analyse report data without having to log on to the system and navigate to the report. The Broadcast work center view can be accessed from the Business Analytics work center.
For Broadcasting, you have two scenarios: Periodic Scheduling and Ad Hoc Broadcasting. With Periodic Scheduling, you can broadcast a report or dashboard on a regular base. An example would be to get a monthly report of the sales performance of the previous month every first Monday of the month. Ad hoc broadcasting is only being broadcasted once and is useful if a specific report requires the attention of multiple users.
Steps to create a Broadcast
- Click on ‘new’ from the Broadcast work center;
- Enter a name, eventually a message and select the report;
- Add the e-mail addresses of the recipients;
- Select the format of the report
- Decide if the report should be broadcasted once, periodically and if periodically for how frequently along with the start and end date of the schedule.
I would like to forward you to the blog of my colleague Okke Scholten for a more detailed explanation about the broadcasting functionality.
I hope that you enjoyed reading this blog and that these forgotten functionalities are useful for your organization.
If you have any questions regarding these topics, please do not hesitate to contact me on Sayana.sathasivam@acorel.nl.
Receive our weekly blog by email?
Subscribe here:

