
Bianca Koene
Read all my blogsTips and Tricks for Business Analytics in SAP Cloud for Customer
Bianca Koene, 24 February 2021
The other day I was creating reports in SAP Cloud for Customer and was happily surprised by some features I did not really use before or that have changed over the years. So, I thought to summarize a few of my favourite features in this blog. A lot can be written about the business analytics functionality in SAP Cloud for Customer, but in this blog I will focus on a few tips that can be most handy for people that are new to the business analytics functionality in SAP Cloud for Customer.
Broadcasts
With the broadcast functionality you can broadcast reports and dashboards to your users via email and plan exactly when you want to send out these broadcasts via periodic scheduling. Also, you can choose not to schedule the broadcast and start sending directly by selecting ‘Start Now’. To be able to set up a broadcast for a report or dashboard you need to have the authorizations to execute the report.
You can send the report or dashboard as an attachment or as an HTML link.
Also, there is a possibility to send your report data encrypted. To use this functionality, you must make changes in the scoping. Go to the “E-mail Encryption and Signature Check” fine-tune activity.
This functionality is useful for example for sending out a list of current opportunities or open activities to your sales reps or send out an overview of team performance to managers. The only disadvantage I see with this functionality is that you can only send the broadcast to SAP Cloud for Customer users. So, you cannot send the report to an email address that does not belong to a user.
Common Tasks
Under Common Tasks you have the possibility to download and upload reports. You can download a report, including referred datasources, key figures and KPIs, from your test system and upload it into your production system. But in the case that you have edited a report directly in your production environment, you can also download it from your production environment and upload it into your test environment. This way you can always keep both environments in sync for your business analytics. It is a very straightforward and easy to use functionality.
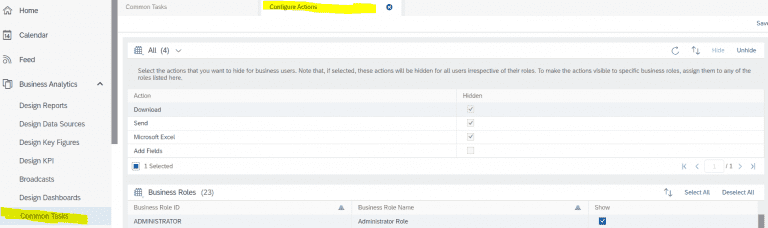
With Common Tasks you also have the possibility to configure actions by selecting what you want to hide for business users, like downloading data, sending data and opening reports in Excel. This can be very important for privacy sensitive information, for example in the case of General Data Protection Regulation (GDPR). You select the actions that you want to hide, this will then be hidden for everyone, independent of role. By selecting specific business roles, you can then exclude the business roles for which this should not be hidden.
Datasources
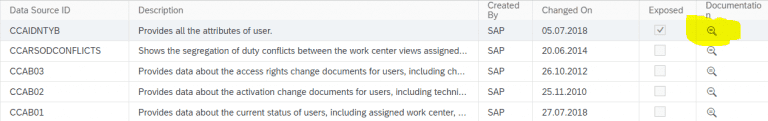
When creating a report, I usually start with analyzing the datasources that are available for your report. Sometimes you can base your report on one datasource and sometimes you need to combine multiple datasources. Here, I just want to show you how you can select the right datasource. When you go to Business Analytics -> Datasources you will find a lot of predelivered datasources by SAP. For example, datasources containing customer information, datasources containing information on opportunities etc. To see what kind of data a datasource offers, you can do two things. First of all, you can run an example by using the Preview option. But a lot of times these datasources contain a lot of information and running an example can take a lot of time to find out the available characteristics and key figures of the datasource. An option I mostly use is the documentation view of a datasource. Now you get a complete overview on details of the datasource, available characteristics and available key figures and their details. Also, you can see here in which other datasources and reports these datasources are being used.
Reports
When I was creating report views, I was still using the dots in the ‘View’ section to change the settings of a character, for example to show a character with only the description, instead of ID and description. However, you can already do this from the character name in the different columns of your report view. Here you can change the display of a character and you can filter for example on the specific character. This way you can very quickly organize your report view.

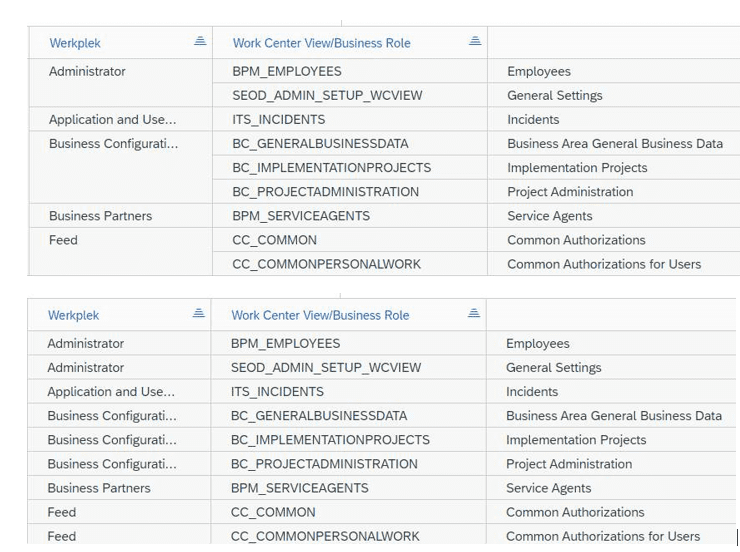
Also, in report settings you have the possibility to change the way tables are designed. You have a standard table design where columns are white and rows are gray or you have an alternated table design where columns are displayed in white and grey alternative rows.
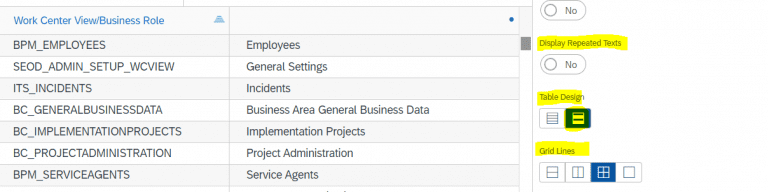
Furthermore, you have the possibility to select gridlines, like in Excel. So only horizontal lines displayed, only vertical lines displayed, both horizontal lines and vertical lines displayed, or no grid lines displayed. A feature I use very often when creating reports is the repeated text option. Standard the table merges repeated texts for each column into one row. When you select this option, you enable repeated display of the same values. This is convenient when you want to download the report to Excel to further process the data.
So, these were just a few tips and tricks that might come handy when creating reports in SAP Cloud for Customer. I hope it can be of help to you.

Receive our weekly blog by email?
Subscribe here:

