
Sophie Derksen
Read all my blogsTake operational reporting to a higher level with SAC embedded in SAP Sales & Service cloud V2
Sophie Derksen, 22 November 2023
In SAP Sales & Service Cloud V2, you have access to an embedded version of SAP Analytics Cloud. This embedded variant possesses many similar functionalities to the enterprise version of SAP Analytics Cloud. The limitations in the embedded variant, or rather the differences, primarily focus on the relevance of the embedded variant for operational analyses based on data in SAP Cloud for Customer, as opposed to the relevance of the enterprise version for consolidating data from multiple systems and building advanced reports relevant for both present and future.
SAC embedded operational reporting
In my opinion, SAC embedded provides an ultimate opportunity to elevate daily analyses to a higher level and aligns with the requirements for a CRM cloud system.
What are examples of the available functionalities in SAC embedded? How do you build a story and make it available for sales and service managers/employees? Those are questions I’ll address in this blog.
Before we start – Building a story
Following the end user goal for SAC embedded as outlined above, it is only possible to build a story in Sales & Service Cloud version 2 and not an analytic application as it is in the SAC enterprise variant. The process of building a story starts with selecting the necessary data sources and fields within those sources, essentially constructing a model. This model contains the chosen data that can be visually presented in a story.
Note: In Sales & Service Cloud version 2, creating a story is considered an administrator’s task. If you’re not an administrator but, let’s say, a BI employee, then request your administrator to enable the following admin service only: sap.crm.analyticsuserstoriesservice.uiapp.anaStoryAdmin.
Let’s start – Building a story
1. Access settings: navigate to “Settings” in the top-right user menu.
2. Find analytics: under “All Settings,” locate and select “Analytics.”
3. Design your story: choose “Design Stories” and start a new story.
4. Design your query: you’ll now land in the query designer. Here, you can select data from the panel on the right to shape your query. Double-click on a datasource to add it to the query designer or drag it directly onto the canvas.
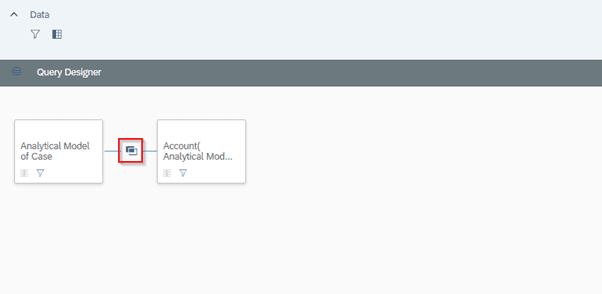
5. Choose datasources: explore the options available within a datasource by clicking on the datasource added to the query designer. You can select columns for your story, display underlying tables, and add filters. You can also create inner joins or left outer joins. To do this, select a datasource you want to merge in the panel on the right and drag it onto the datasource that is already in the designer. An icon outlined below will appear, click on it, and choose the desired merging method.
6. Model completion: once you’ve finished and added the desired fields from various data sources to the query, you can save it and proceed to build a story.
7. Name your model: Click on ‘Finish’ and give your model a name.
You’ve now arrived at the place where you can create a story from the data you’ve just selected. In this blog, I’ll briefly explain the most important functionalities. These individual functionalities will be covered in more detail in future blogs.
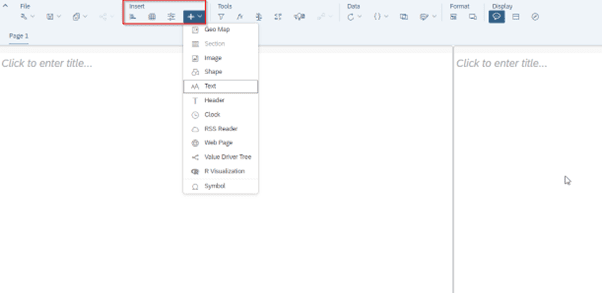
8. Choosing Visuals: utilize the ‘Insert’ tab to pick appropriate data representations like bar charts.
9. Build your chart: in the builder, select the necessary measures and dimensions that you want to display in your story, and if desired, add some filters.
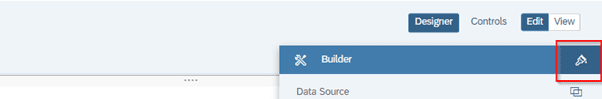
10. Style your chart: you can switch to the styling panel at the top right of the builder, where you have extensive styling options. Give the desired style settings.
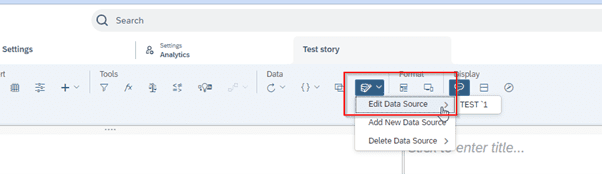
11. Final touches and saving: in some cases, you might find yourself needing to add additional data to your data source while constructing your story, in order to visualize it within the story. At that point, you can use the button below to go back to your data source and make the necessary adjustments.
Look at the top bar and find out more about the possibilities for your story. As mentioned, I will not be handling these in this blog. But they might come up in future blogs, so stay tuned.
12. Review: review your story one last time and click on ‘Save’.
Enable stories for end users
The following conditions must be met for users to see the desired stories.
– sap.crm.analyticsbusinessuserstoriesservice.uiapp.anaStoryBusinessUser added to their business role to be able to see the service “Analytical Stories” in their menu.
– The story must be assigned to the business roles of the users that need them. This is done by selecting the desired story in the admin service and assigning it to the business role(s) it is intended for, via the button in the top right corner.
Receive our weekly blog by email?
Subscribe here:

